UK House Prices November 2026: Latest Figures and What Comes Next
Quick answer: The average UK house price was £273,000 in September 2026, up 1.2% on a year earlier, according to the official UK House Price Index published on 18 November 2026. Prices fell 0.5% on the month (unchanged after seasonal adjustment). London is the weakest region at £545,579, down 3.5% a year, while the North East is the strongest at +4.6%. Asking prices fell 1.8% in November (Rightmove) and the Bank of England raised Bank Rate to 4% on 5 November, so most forecasters expect prices to stay flat or dip slightly into early 2027.
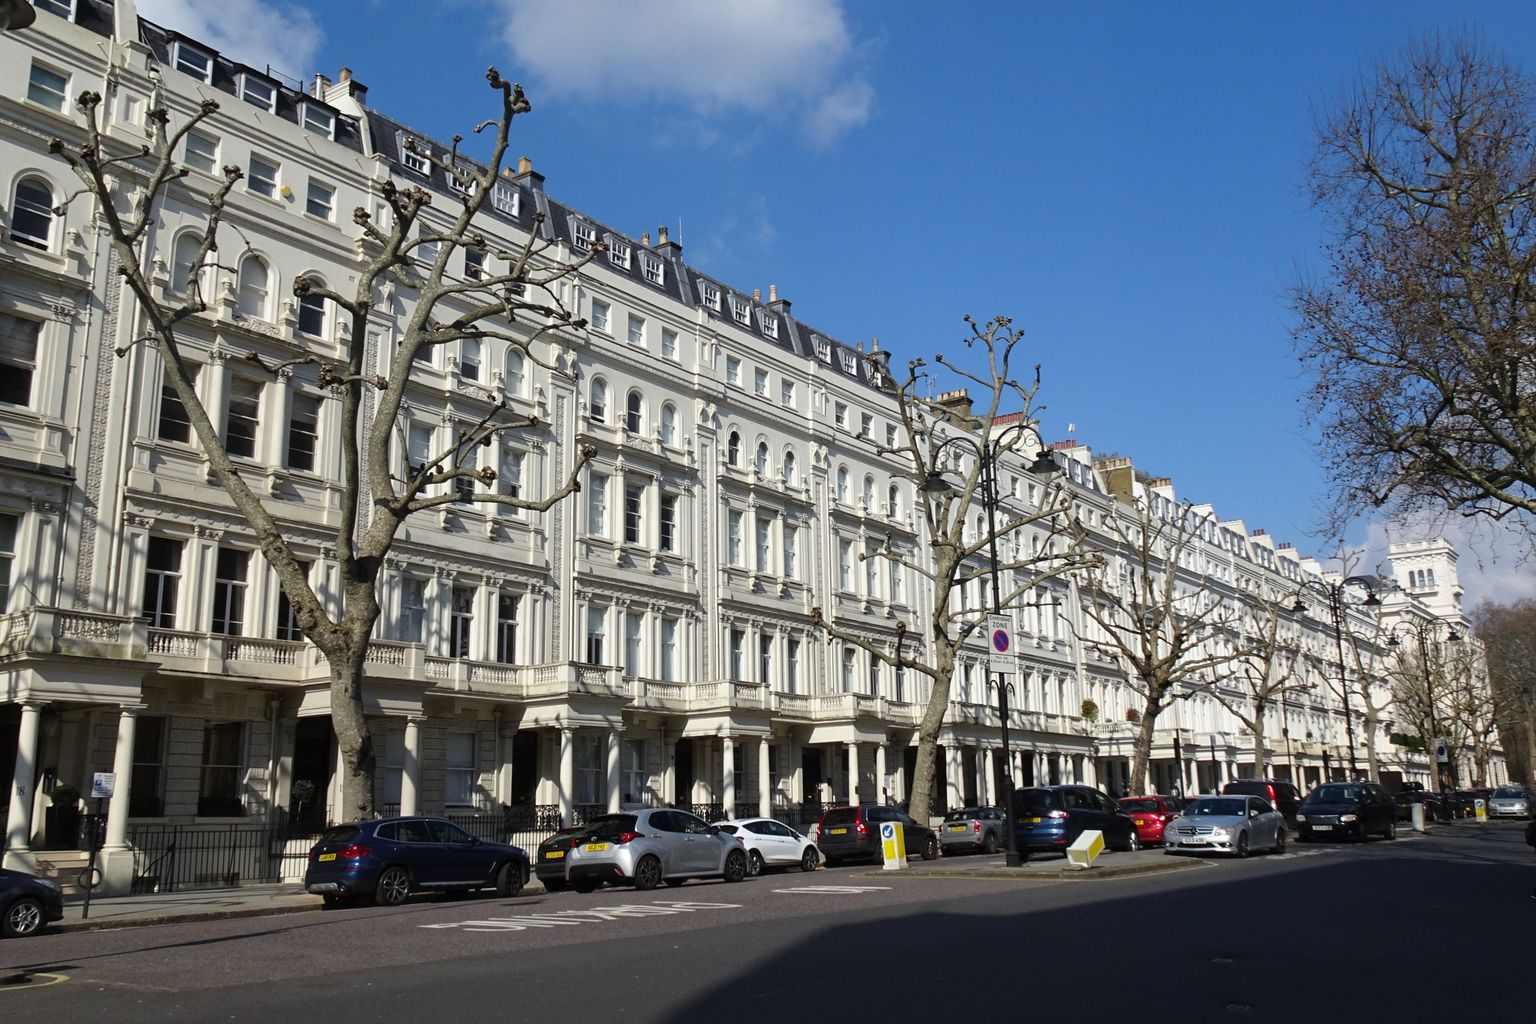
Average house price by country
Official UK House Price Index, September 2026 (published 18 November 2026). Northern Ireland figures are for July to September.
| Area | Average price | Change in a year | Change in a month |
|---|---|---|---|
| United Kingdom | £272,642 | +1.2% | -0.5% |
| England | £292,998 | +0.8% | -0.4% |
| Wales | £214,548 | +1.8% | -1.2% |
| Scotland | £197,975 | +2.3% | -0.7% |
| Northern Ireland (Q3) | £207,272 | +7.4% | +2.7% (quarter) |
House prices by region in England
| Region | Average price | Change in a year |
|---|---|---|
| London | £545,579 | -3.5% |
| South East | £378,915 | -0.2% |
| East of England | £338,357 | +0.7% |
| South West | £301,616 | +0.3% |
| West Midlands | £250,355 | +0.9% |
| East Midlands | £242,863 | +1.3% |
| North West | £220,477 | +3.2% |
| Yorkshire and The Humber | £210,799 | +2.9% |
| North East | £166,649 | +4.6% |
The north–south gap keeps widening: cheaper northern regions are still rising by 3% to 5% a year while London and the South East fall. Inside London, inner boroughs are down 7.2% a year and outer London is roughly flat (-0.1%).
London house prices
London’s average of £545,579 is 3.5% lower than a year ago and 1.4% lower than in August. Flats are pulling the market down: across the UK, flat and maisonette prices fell 2.3% in a year, the only property type to fall. For buyers this means more room to negotiate in central London, especially on flats with high service charges. See our guide to the best areas to live in London or browse London homes for sale.
Prices by property type and buyer
| Type | Average price | Change in a year |
|---|---|---|
| Detached | £447,677 | +1.6% |
| Semi-detached | £278,368 | +2.6% |
| Terraced | £231,525 | +1.8% |
| Flat or maisonette | £191,864 | -2.3% |
| First-time buyers (GB) | £229,110 | +1.0% |
| Former owner-occupiers (GB) | £335,977 | +1.0% |
What the other indices say
- Rightmove (16 November): average asking price £364,270, down 1.8% in a month (the usual November fall is 1.1%) and 0.2% lower than a year ago. London asking prices average £662,118. Buyer demand is 8% lower than last year and sales agreed are down 7%.
- Nationwide (October): average £273,566, annual growth 0.5%, the weakest since January 2024, with prices flat on the month after seasonal adjustment.
Rightmove measures asking prices of newly listed homes, and Nationwide uses its own mortgage approvals. The official index uses completed sales registered at HM Land Registry, so it lags by about two months but covers every sale.
House price forecast: December 2026 and early 2027
- Mortgage rates are up. The Bank of England raised Bank Rate from 3.75% to 4% on 5 November and markets expect another rise in February 2027. Average 2-year and 5-year fixes are close to 6%. See mortgage rates this month.
- Demand is softer. Fewer buyers and more listings point to flat or slightly lower prices over the winter, with London and flats weakest.
- Rents keep rising. The average UK private rent was £1,411 a month in October (+3.8% a year); London averages £2,350. High rents keep some first-time buyers in the market.
The next official figures (October 2026 data) are due on 16 December 2026. We update this page every month with the new numbers.
What this means for you
- Buying: check how much a rate rise changes your payment with the mortgage calculator and budget for stamp duty.
- Selling: price realistically from day one; homes that are cut later tend to sell for less. Get a free property valuation first.
- Landlords: falling prices with rising rents lift yields. Run the numbers in the rental yield calculator.
Frequently asked questions
What is the average house price in the UK?
The average UK house price was £273,000 (£272,642) in September 2026, up 1.2% in a year, according to the official UK House Price Index published on 18 November 2026.
Are house prices falling in the UK?
Nationally prices are still up about 1% a year, but they fell 0.5% in September and London prices are down 3.5% a year. Asking prices fell 1.8% in November.
What is the average house price in London?
£545,579 in September 2026, down 3.5% on a year earlier. Inner London is down 7.2% and outer London is roughly flat.
Will house prices go down in 2027?
Most forecasters expect flat or slightly lower prices in early 2027 because mortgage rates rose after the Bank Rate increase to 4%. Northern regions are still rising.
When are the next official house price figures?
The UK House Price Index for October 2026 is due on 16 December 2026 at 9:30am.
Sources
- HM Land Registry: UK House Price Index summary, September 2026
- ONS: Private rent and house prices, UK: November 2026
- Rightmove House Price Index (16 November 2026)
- Nationwide House Price Index (October 2026)
- Bank of England: November 2026 Monetary Policy Summary
Figures checked on 20 November 2026. This article is general information, not legal or financial advice.